The PumpStriker Dashboard: A Tab-by-Tab Tour
By Bathyr Devs · Published June 24, 2026
Your command center. PumpStriker comes with a self-hosted web dashboard that shows you everything the engine sees in real time, every token scanned, every signal fired, every winner, every miss. This chapter is a guided tour, tab by tab.
How to open the dashboard
- Make sure
ENABLE_DASHBOARD=1is set in your.env. - In a fresh terminal (engine + bot already running), navigate to your PumpStriker folder and run:
npm run dashboard
- Open your browser to http://localhost:3000 (local) or
http://your-vps-ip:3000(VPS). - You should see the PumpStriker dashboard with the cyber-shark logo, the live ticker tape, and 8 tabs at the top.
⚠️ VPS users: Port 3000 is closed by default. To open it:
sudo ufw allow 3000/tcp. Then put it behind Cloudflare Tunnel or a VPN, the dashboard has no built-in authentication.
The header bar (always visible)
At the top of every tab you'll see:
- Cyber-shark logo + "PumpStriker", brand mark, links to home
- Status pill, green = healthy, red = engine offline, yellow = degraded
- 4 live stat tiles, TOKENS SCANNED, SIGNALS FIRED, TRACKED NOW, AVG PEAK PNL, updated in real time
- Scrolling ticker tape, live tokens with their state pill (BUY / WATCH / STRONG / ALPHA / SKIP) and current PnL
The 8 tabs (left to right)
| Tab | Counter | What it is |
|---|---|---|
| 📺 Live Feed | total spotted | Real-time stream of every token being scored, newest first |
| 📜 Tokens | total spotted | All spotted tokens as a sortable / filterable table |
| 🔥 Signals | fired only | Tokens that actually fired above your score threshold |
| 🏆 Hall of Fame | top performers | Best-performing tokens you spotted (sorted by peak gain) |
| 🎭 Hall of Shame | rugs / duds | Tokens that crashed right after we called them, full transparency |
| 💎 Winners | ≥2x | Tokens that hit 2x peak or better since you spotted them |
| ⚡ Swap | , | Embedded Jupiter widget for manual swaps (uses your browser wallet, not the bot wallet) |
| ⚙️ Engine | , | Telemetry: WS state, RPC latency, hard-kill counters, scanner heartbeat |
Filter pills under every tab: ALL · STRONG · BUY · WATCH · SKIP. Sort dropdown: Newest · Highest Score · Peak % · Market Cap · Liquidity.
📺 Tab 1, Live Feed
 PumpStriker dashboard, Live Feed tab
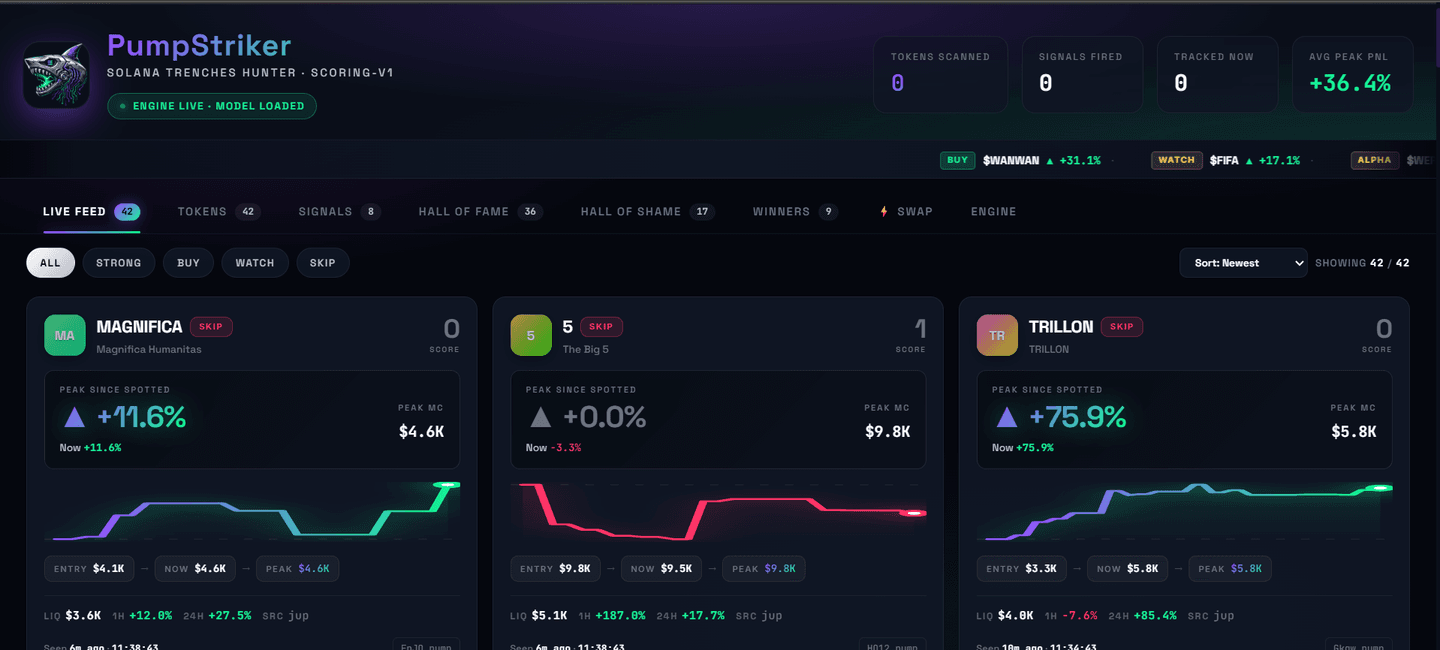
Live Feed is the firehose. Every token the engine touches, whether it scores 0 (skipped) or 100 (legendary), shows up here in real time, newest at the top. Each card shows the ticker, full name, grade chip (SKIP / WATCH / BUY / STRONG / ALPHA), the engine's score 0-100, peak-since-spotted %, current PnL, a sparkline, entry/now/peak market caps, liquidity, 1H and 24H momentum, the data source, and how long ago it was first spotted.
When to use this tab
- Watch the engine "breathe", see what it's scoring in real time
- Sanity check, if Live Feed is empty for 5 minutes, your WebSocket dropped (check
pm2 logs) - Find borderline picks, filter to
WATCHorBUYand scan for tokens climbing into signal range
📜 Tab 2, Tokens
 PumpStriker dashboard, Tokens tab
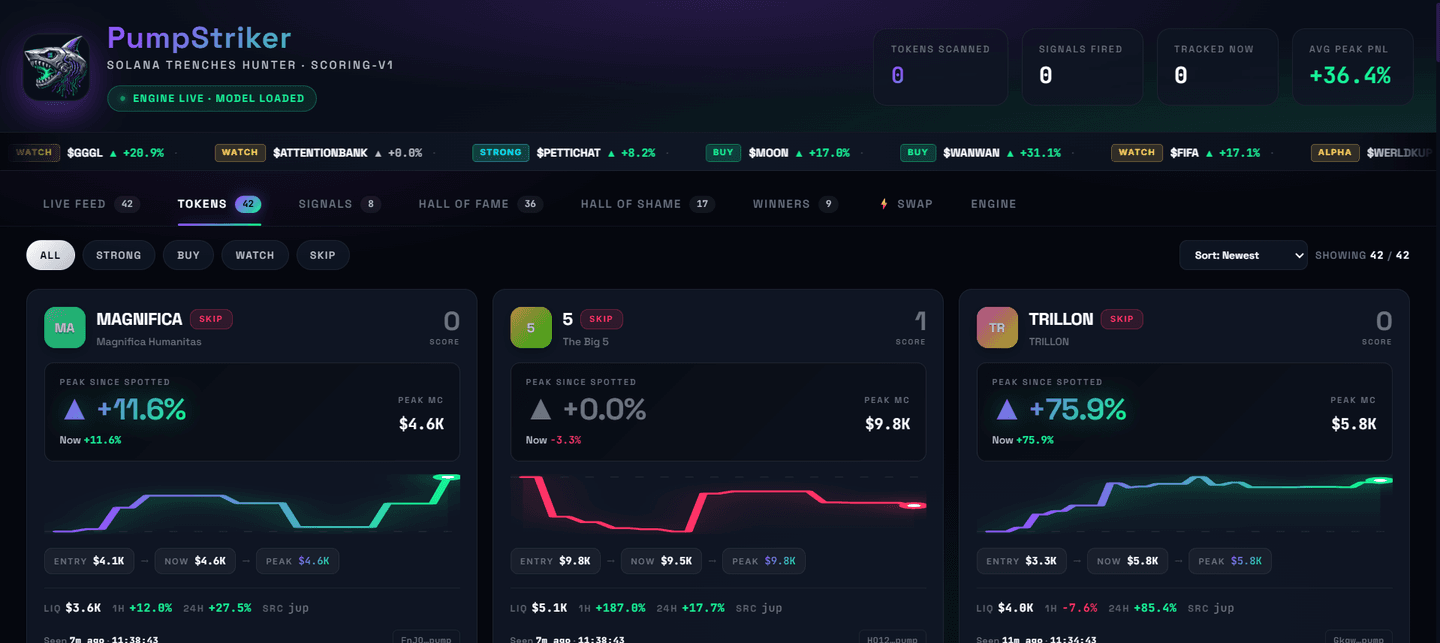
Tokens is the all-time index. Same card style as Live Feed, but this is the persistent table, every token ever spotted, not just the live stream.
| Live Feed | Tokens |
|---|---|
| Real-time push stream, newest first | Persistent table, fully sortable |
| Newer items push older off-screen | Nothing falls off, historical log |
| Best for monitoring NOW | Best for browsing HISTORY |
Use it to look up a specific token, audit the bot's behavior ("did the engine see X earlier today?"), or find missed alpha (filter by STRONG/BUY, sort by Peak %).
🔥 Tab 3, Signals
 PumpStriker dashboard, Signals tab
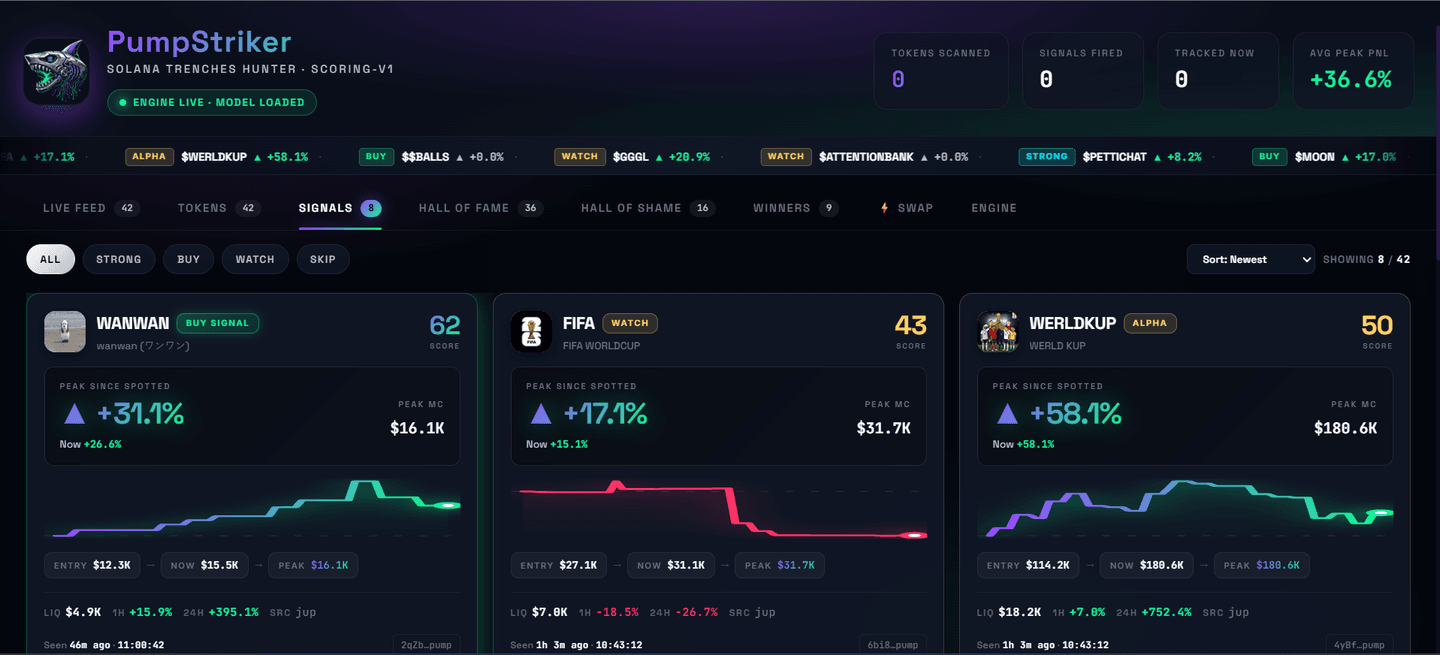
Signals = tokens that actually fired to your Telegram. Only tokens that crossed your MIN_SIGNAL_SCORE threshold appear here. The SCORE is shown in yellow/gold to mark elevated tier.
Use this tab to verify the bot is firing, review the day's calls and tune your threshold, and compare what fired vs what you actually acted on.
💡 Pro tip: If this tab is empty after a few hours, your threshold is too high, lower
MIN_SIGNAL_SCOREin.envby 5 points and restart the engine.
🏆 Tab 4, Hall of Fame
 PumpStriker dashboard, Hall of Fame tab
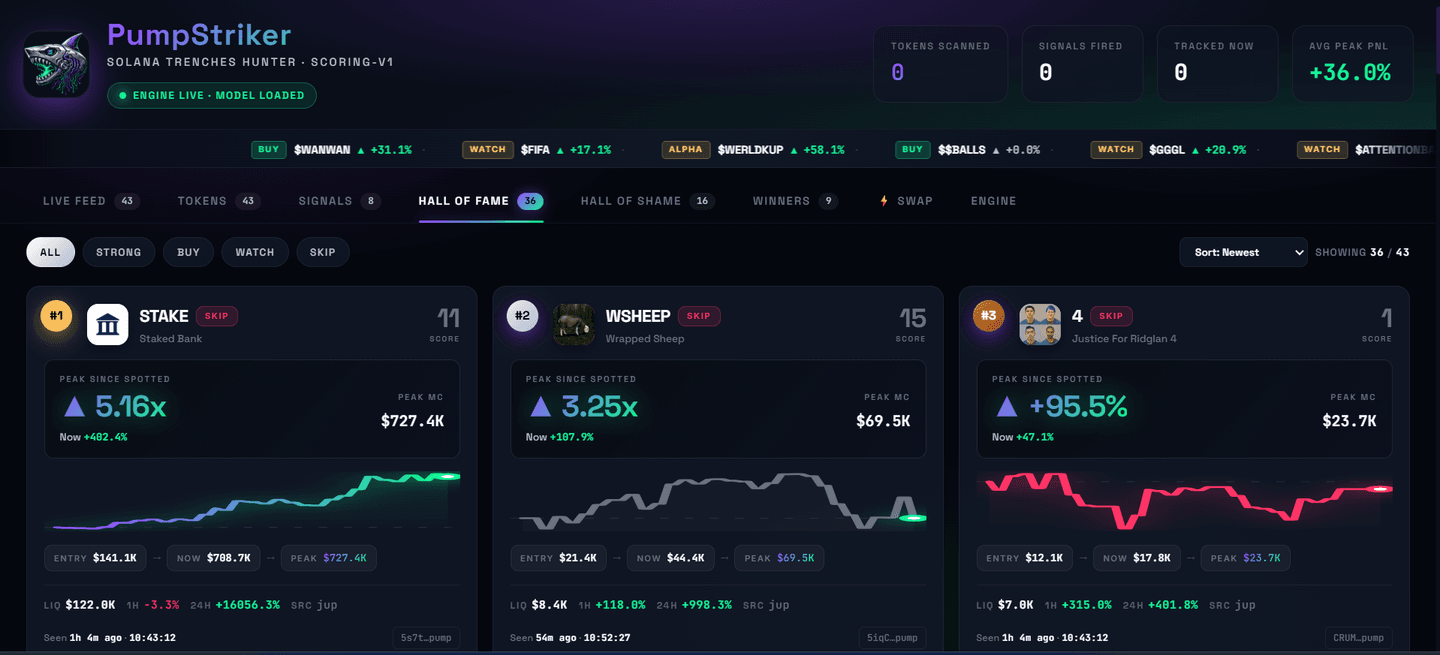
Your best calls. Cards ranked #1, #2, #3 by peak gain, the proof: tokens the engine spotted that went on to multiply. Big winners use multiplier notation (5.16x, 3.25x). The sparkline shows the whole pump journey, the climb, the peak, and the (sometimes brutal) drawdown.
Use it for pattern study (what did the winners share at entry?) and to tune your scorer, if Hall of Fame is empty but Hall of Shame is full, your scoring weights are off.
🎭 Tab 5, Hall of Shame
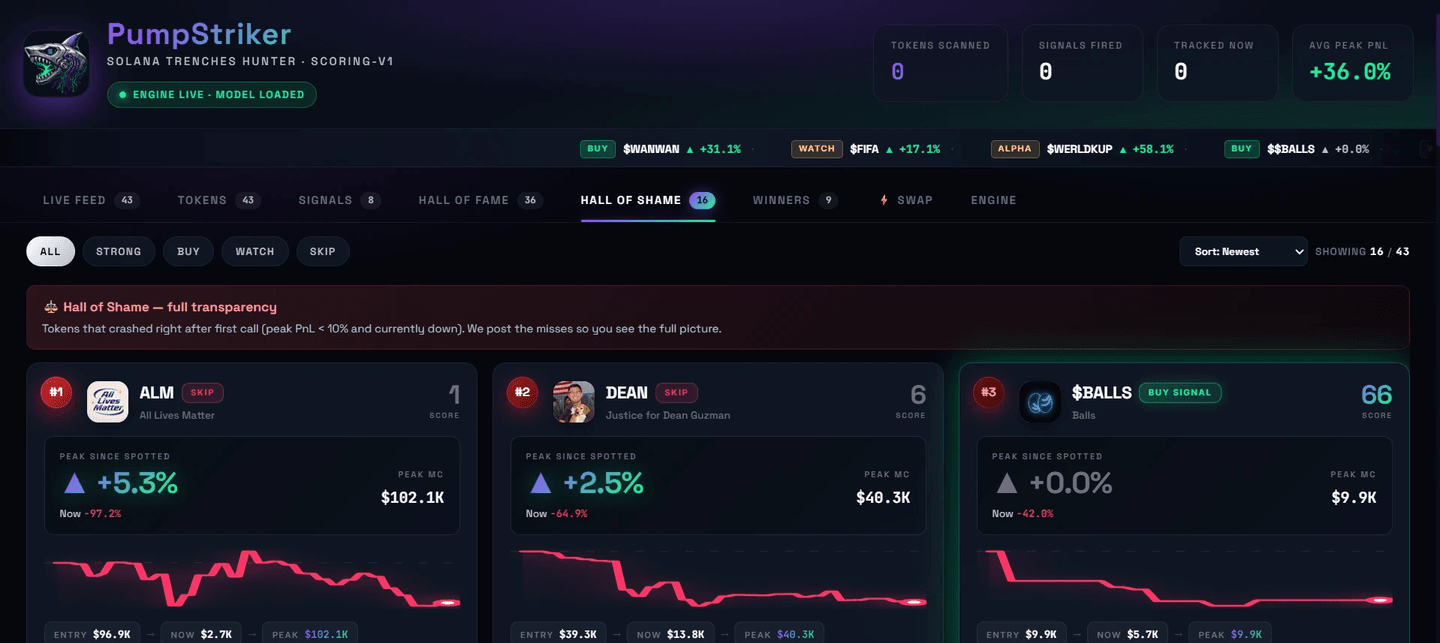 PumpStriker dashboard, Hall of Shame tab
Full transparency on the misses. Red-bordered cards: tokens that crashed right after first call. Most bot vendors hide their misses; PumpStriker shows them on purpose. Three reasons:
- Honesty, you see the real hit rate, not the cherry-picked one
- Tuning data, every shame entry is a chance to improve the scorer
- Risk education, memecoins are high-variance even with a good engine
If your Shame:Fame ratio is high, your MIN_SIGNAL_SCORE is too low.
💎 Tab 6, Winners
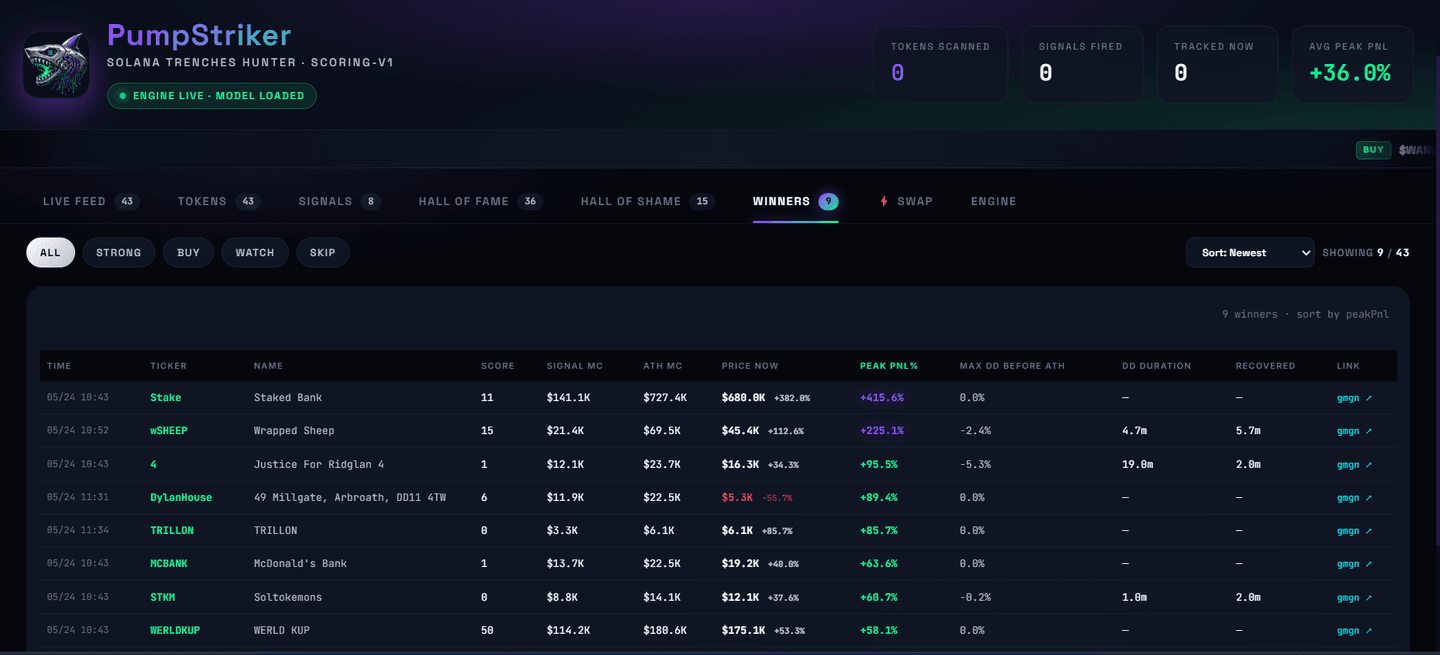 PumpStriker dashboard, Winners tab
Tokens that hit at least 2x peak since you spotted them. A stricter subset of Hall of Fame. Each card also shows two stress-test stats not visible elsewhere:
- DD-before-ATH, max drawdown the token suffered BEFORE its all-time-high. If 60%+, you'd likely have been shaken out before the moon.
- Price Now, red if currently below your spot entry, green if still above.
Use it to decide TP discipline (if winners' DD-before-ATH is huge, your TP1 may exit too early) and to find recurring entry patterns.
⚡ Tab 7, Swap
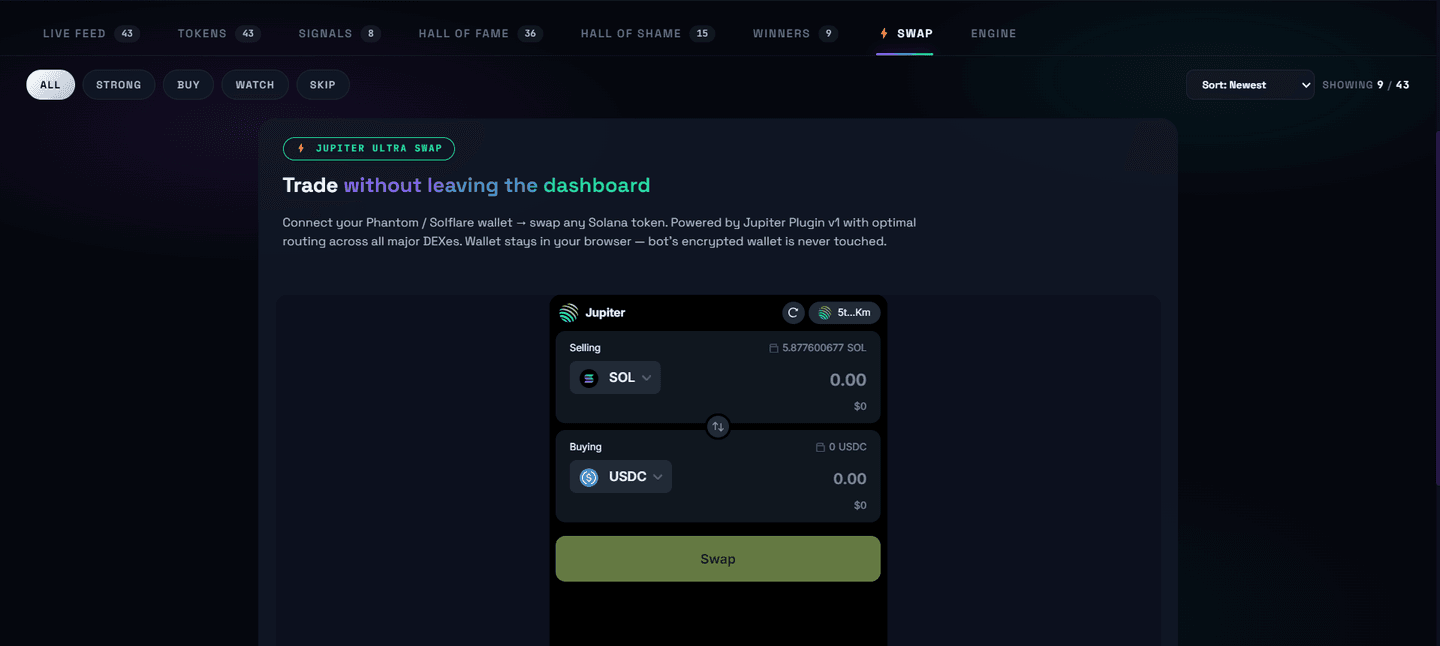 PumpStriker dashboard, Swap tab
Embedded Jupiter Plugin widget. Connect your own browser wallet (Phantom, Solflare), the bot's hot wallet is never touched here. Used for quick manual swaps without leaving the dashboard, and for testing routes.
⚙️ Tab 8, Engine
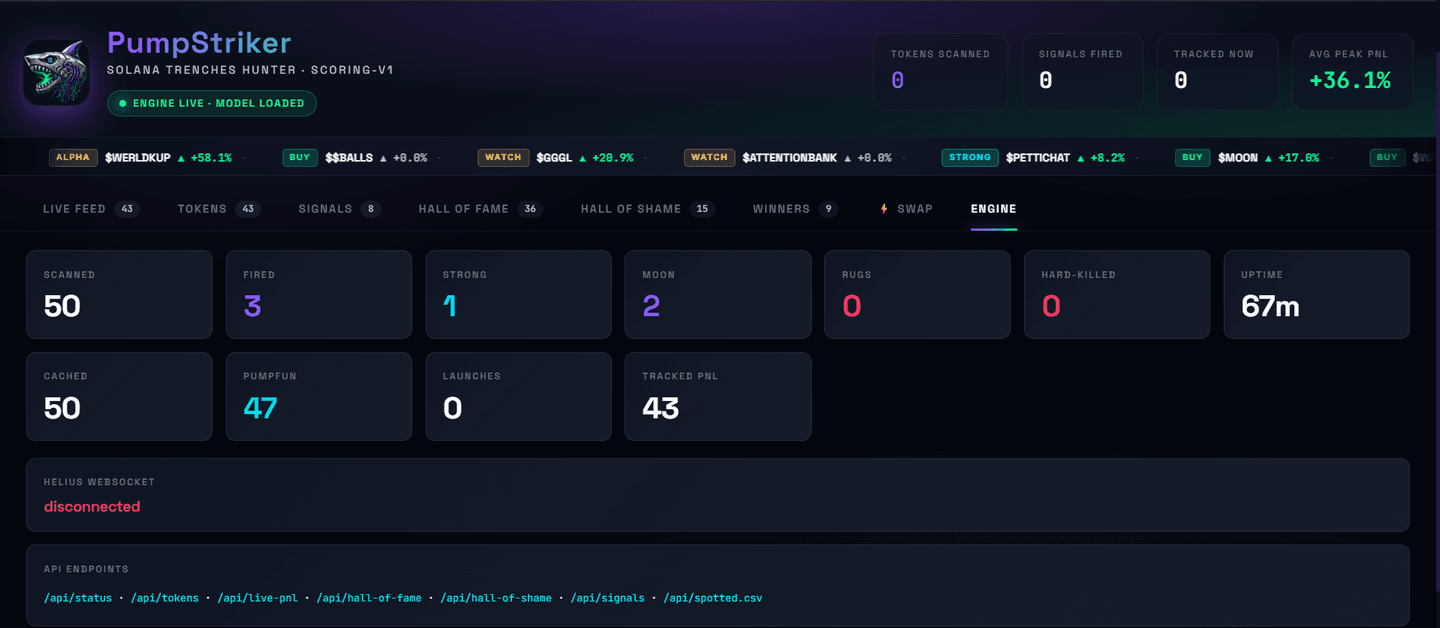 PumpStriker dashboard, Engine telemetry tab
Engine telemetry dump, refreshing every few seconds. What to look for:
- WebSocket: CONNECTED (green), if RED, Helius WS dropped, restart engine
- RPC latency, if Helius p50 latency > 500ms, your trades will land late
- Scanner heartbeat, each scanner (DexScreener, PumpFun, GMGN) reports last fetch time
- Hard-kill counters, how many tokens got killed by each rule (INVISIBLE_RUG, HONEYPOT, BUBBLE_MAP, etc.) since boot
This is your vital-signs monitor. If something feels off, this is the first tab to check.
What could go wrong?
| Symptom | Fix |
|---|---|
| Dashboard loads but tabs are empty | Engine is not running, OR ENABLE_DASHBOARD=0. Set to 1 and restart engine. |
| Tabs show stale data, never updates | SSE connection dropped. Hard-refresh (Ctrl+Shift+R). |
Connection refused at localhost:3000 | You didn't run npm run dashboard. Open a third terminal and start it. |
| VPS dashboard unreachable from my home | UFW blocking port 3000. Run sudo ufw allow 3000/tcp. Then put it behind Cloudflare Tunnel, do not leave port 3000 open to the public internet. |
➡️ Next chapter: 9. Troubleshooting + FAQ, when things break (they sometimes do).
PumpStriker, the self-hosted Solana memecoin striker.
Your keys. Your machine. One-time $350, MIT licensed, no subscription.
See pricing →